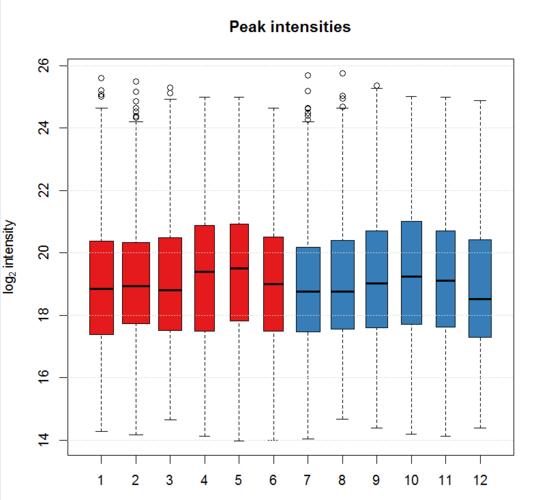
xcms是基于R语言设计的程序包(R package),可以用分析代谢组数据等下面我们就来介绍一下使用方法操作步骤示例数据是fatty acid amide hydrolase (FAAH) 基因敲除鼠的脊柱LC-MS,六个基因敲除个体,六个野生型,使用的是centroid mode ,正离子模式,200-600 m/z ,2500-4500 secondssource("https://bioconductor.org/biocLite.R")yum install netcdfyum install netcdf-devel.x86_64biocLite("xcms")biocLite("ncdf4")biocLite("faahKO")biocLite("MSnbase")library(xcms)library(faahKO)library(RColorBrewer)library(pander)#读取数据cdfs <- dir(system.file("cdf", package = "faahKO"), full.names = TRUE,recursive = TRUE)> cdfs[1] "C:/Program Files/R/R-3.4.2/library/faahKO/cdf/KO/ko15.CDF" "C:/Program Files/R/R-3.4.2/library/faahKO/cdf/KO/ko16.CDF" "C:/Program Files/R/R-3.4.2/library/faahKO/cdf/KO/ko18.CDF"[4] "C:/Program Files/R/R-3.4.2/library/faahKO/cdf/KO/ko19.CDF" "C:/Program Files/R/R-3.4.2/library/faahKO/cdf/KO/ko21.CDF" "C:/Program Files/R/R-3.4.2/library/faahKO/cdf/KO/ko22.CDF"[7] "C:/Program Files/R/R-3.4.2/library/faahKO/cdf/WT/wt15.CDF" "C:/Program Files/R/R-3.4.2/library/faahKO/cdf/WT/wt16.CDF" "C:/Program Files/R/R-3.4.2/library/faahKO/cdf/WT/wt18.CDF"[10] "C:/Program Files/R/R-3.4.2/library/faahKO/cdf/WT/wt19.CDF" "C:/Program Files/R/R-3.4.2/library/faahKO/cdf/WT/wt21.CDF" "C:/Program Files/R/R-3.4.2/library/faahKO/cdf/WT/wt22.CDF"#构建样式矩阵pd <- data.frame(sample_name = sub(basename(cdfs), pattern = ".CDF",replacement = "", fixed = TRUE),sample_group = c(rep("KO", 6), rep("WT", 6)),stringsAsFactors = FALSE)> pdsample_name sample_group1 ko15 KO2 ko16 KO3 ko18 KO4 ko19 KO5 ko21 KO6 ko22 KO7 wt15 WT8 wt16 WT9 wt18 WT10 wt19 WT11 wt21 WT12 wt22 WT#读取数据raw_data <- readMSData(files = cdfs, pdata = new("NAnnotatedDataFrame", pd),mode = "onDisk")#查看保留时间> head(rtime(raw_data))F01.S0001 F01.S0002 F01.S0003 F01.S0004 F01.S0005 F01.S00062501.378 2502.943 2504.508 2506.073 2507.638 2509.203#查看质荷比> head(mz(raw_data))$F01.S0001[1] 200.1 201.0 201.9 202.9 203.8 204.2 205.1 206.0 207.0 208.0 209.1 210.0 211.0 212.0 213.0 214.0 215.1 216.1 217.1 218.0 219.0 220.0 220.9 222.0 223.1 224.1 225.0 226.0 227.1 228.0#查看强度> head(intensity(raw_data))$F01.S0001[1] 1716 1723 2814 1961 667 676 1765 747 2044 757 1810 926 3381 1442 1688 1223 1465 1624 2446 1309 2167 900 5471 873 2285 1355 2610 1797 6494 2314#按文件分割数据mzs <- mz(raw_data)mzs_by_file <- split(mzs, f = fromFile(raw_data))length(mzs_by_file)#总体评价图bpis <- chromatogram(raw_data, aggregationFun = "max")group_colors <- brewer.pal(3, "Set1")[1:2]names(group_colors) <- c("KO", "WT")plot(bpis, col = group_colors[raw_data$sample_group])#查看某个个体bpi_1 <- bpis[1, 1]plot(bpi_1, col = group_colors[raw_data$sample_group])#查看样品离子流tc <- split(tic(raw_data), f = fromFile(raw_data))boxplot(tc, col = group_colors[raw_data$sample_group],ylab = "intensity", main = "Total ion current")#定义保留时间与质荷比,提取特定的峰rtr <- c(2700, 2900)mzr <- c(334.9, 335.1)chr_raw <- chromatogram(raw_data, mz = mzr, rt = rtr)plot(chr_raw, col = group_colors[chr_raw$sample_group])#提取质谱数据msd_raw <- extractMsData(raw_data, mz = mzr, rt = rtr)plotMsData(msd_raw[[1]])#定义峰宽与噪音,自动找出所有的峰cwp <- CentWaveParam(peakwidth = c(30, 80), noise = 1000)xdata <- findChromPeaks(raw_data, param = cwp)head(chromPeaks(xdata))#统计检测到的峰summary_fun <- function(z) {c(peak_count = nrow(z), rt = quantile(z[, "rtmax"] - z[, "rtmin"]))}T <- lapply(split.data.frame(chromPeaks(xdata),f = chromPeaks(xdata)[, "sample"]),FUN = summary_fun)T <- do.call(rbind, T)rownames(T) <- basename(fileNames(xdata))pandoc.table(T,caption = paste0("Summary statistics on identified chromatographic"," peaks. Shown are number of identified peaks per"," sample and widths/duration of chromatographic ","peaks."))#画某个样品的峰图plotChromPeaks(xdata, file = 3)#对所有样品画热图plotChromPeakImage(xdata)#标注某个峰的差异plot(chr_raw, col = group_colors[chr_raw$sample_group], lwd = 2)highlightChromPeaks(xdata, border = group_colors[chr_raw$sample_group],lty = 3, rt = rtr, mz= mzr)#提取某个峰所有样品的数据pander(chromPeaks(xdata, mz = mzr, rt = rtr),caption = paste("Identified chromatographic peaks in a selected ","m/z and retention time range."))#画峰强的箱线图ints <- split(log2(chromPeaks(xdata)[, "into"]),f = chromPeaks(xdata)[, "sample"])boxplot(ints, varwidth = TRUE, col = group_colors[xdata$sample_group],ylab =expression(log[2]~intensity), main = "Peak intensities")grid(nx = NA, ny = NULL)# 设定binSizexdata <- adjustRtime(xdata, param = ObiwarpParam(binSize = 0.6))#查看校正过的保留时间head(adjustedRtime(xdata))#查看校正前的保留时间> head(rtime(xdata, adjusted = FALSE))#画校正保留时间后的峰图及校正后与校正前的差异bpis_adj <- chromatogram(xdata, aggregationFun = "max")par(mfrow = c(2, 1), mar = c(4.5, 4.2, 1, 0.5))plot(bpis_adj, col = group_colors[bpis_adj$sample_group])#查看数据是否校正过时间hasAdjustedRtime(xdata)[1] TRUE#恢复到没校正的状态xdata <- dropAdjustedRtime(xdata)hasAdjustedRtime(xdata)[1] FALSE#根据样品组设定参数pdp <- PeakDensityParam(sampleGroups = xdata$sample_group,minFraction = 0.8)#根据组来提取数据xdata <- groupChromPeaks(xdata, param = pdp)#根据组来校正时间pgp <- PeakGroupsParam(minFraction = 0.85)xdata <- adjustRtime(xdata, param = pgp)#对校正前和校正后的结果作图plotAdjustedRtime(xdata, col = group_colors[xdata$sample_group],peakGroupsCol = "grey", peakGroupsPch = 1)#对校正前和校正后的某个峰作图par(mfrow = c(2, 1))plot(chr_raw, col = group_colors[chr_raw$sample_group])chr_adj <- chromatogram(xdata, rt = rtr, mz = mzr)plot(chr_adj, col = group_colors[chr_raw$sample_group])#选择一种质荷比,提取峰图mzr <- c(305.05, 305.15)chr_mzr <- chromatogram(xdata, mz = mzr, rt = c(2500, 4000))par(mfrow = c(3, 1), mar = c(1, 4, 1, 0.5))cols <- group_colors[chr_mzr$sample_group]plot(chr_mzr, col = cols, xaxt = "n", xlab = "")highlightChromPeaks(xdata, mz = mzr, col = cols, type = "point", pch = 16)#画一级质谱和二级质谱的峰图mzr <- c(305.05, 305.15)chr_mzr_ms1 <- chromatogram(filterMsLevel(xdata, 1), mz = mzr, rt = c(2500, 4000))plot(chr_mzr_ms1)chr_mzr_ms2 <- chromatogram(filterMsLevel(xdata, 2), mz = mzr, rt = c(2500, 4000))plot(chr_mzr_ms2)#定义峰提取参数pdp <- PeakDensityParam(sampleGroups = xdata$sample_group,minFraction = 0.4, bw = 30)par(mar = c(4, 4, 1, 0.5))plotChromPeakDensity(xdata, mz = mzr, col = cols, param = pdp,pch = 16, xlim = c(2500, 4000))#用不同的峰提取参数,bw定义了距离多少的两个峰合并为一个峰pdp <- PeakDensityParam(sampleGroups = xdata$sample_group,minFraction = 0.4, bw = 20)plotChromPeakDensity(xdata, mz = mzr, col = cols, param = pdp,pch = 16, xlim = c(2500, 4000))#提取数据,minFraction是占所有样本百分之多少以上的峰视为正确的数据pdp <- PeakDensityParam(sampleGroups = xdata$sample_group,minFraction = 0.4, bw = 20)xdata <- groupChromPeaks(xdata, param = pdp)featureDefinitions(xdata)#对结果分组head(featureValues(xdata, value = "into"))#利用原始数据对NA进行回填xdata <- fillChromPeaks(xdata)head(featureValues(xdata))#查看回填前的NAapply(featureValues(xdata, filled = FALSE), MARGIN = 2,FUN = function(z) sum(is.na(z)))#查看回填后的NAapply(featureValues(xdata), MARGIN = 2,FUN = function(z) sum(is.na(z)))#PCAft_ints <- log2(featureValues(xdata, value = "into"))pc <- prcomp(t(na.omit(ft_ints)), center = TRUE)cols <- group_colors[xdata$sample_group]pcSummary <- summary(pc)plot(pc$x[, 1], pc$x[,2], pch = 21, main = "", xlab = paste0("PC1: ", format(pcSummary$importance[2, 1] 100,digits = 3), " % variance"),ylab = paste0("PC2: ", format(pcSummary$importance[2, 2] 100,digits = 3), " % variance"),col = "darkgrey", bg = cols, cex = 2)grid()text(pc$x[, 1], pc$x[,2], labels = xdata$sample_name, col = "darkgrey",pos = 3, cex = 2)#查看数据处理历史,经过了Peak detection、Peak grouping、Retention time correction、Peak grouping、Missing peak fillingprocessHistory(xdata)#提取某一步的数据ph <- processHistory(xdata, type = "Retention time correction")ph#提取数据的参数processParam(ph[[1]])#提取某个文件的数据subs <- filterFile(xdata, file = c(2, 4))#提取数据并留取保留时间subs <- filterFile(xdata, keepAdjustedRtime = TRUE)#按保留时间提取数据subs <- filterRt(xdata, rt = c(3000, 3500))range(rtime(subs))#提取某个文件的所有数据one_file <- filterFile(xdata, file = 3)one_file_2 <- xdata[fromFile(xdata) == 3]#查看峰文件head(chromPeaks(xdata))#导出数据result<-cbind(as.data.frame(featureDefinitions(xdata)),featureValues(xdata, value = "into"))write.table(result,file="xcms_result.txt",sep="\t",quote=F)#PCAvalues <- groupval(xdata)data <- t(values)pca.result <- pca(data)library(pcaMethods)pca.result <- pca(data)loadings <- pca.result@loadingsscores <- pca.result@scoresplotPcs(pca.result, type = "scores",col=as.integer(sampclass(xdata)) + 1)#MDSlibrary(MASS)for (r in 1:ncol(data))data[,r] <- data[,r] / max(data[,r])data.dist <- dist(data)mds <- isoMDS(data.dist)plot(mds$points, type = "n")text(mds$points, labels = rownames(data),col=as.integer(sampclass(xdata))+ 1 )好了,以上就是使用xcms分析代谢组数据的操作如果文章对你有所帮助,请转发给你身边需要的人噢
关注我们Get更多科研小工具


0 评论